Section 2 Model training
2.1 Simulation experiment with 99% unlabeled data set.
2.1.1 Analysis
In Python:
from sklearn.datasets import make_classification
import pandas as pd
from sklearn.ensemble import RandomForestClassifier
import numpy as np
from sklearn.impute import SimpleImputer
from sklearn.preprocessing import MinMaxScaler
from scipy.spatial import distance
from purf.pu_ensemble import PURandomForestClassifier
import pickle
import os
import re
import session_info
X_list = []
y_list = []
for i in range(5):
X, y = make_classification(
n_samples = 5000,
n_features = 300,
n_informative = 250,
n_redundant = 40,
n_repeated = 10,
n_classes = 2,
n_clusters_per_class = 1,
class_sep = 2,
random_state = i+1)
X = pd.DataFrame(X)
# Check the contents of the set
print('%d data points and %d features' % (X.shape))
print('%d positive out of %d total' % (sum(y), len(y)))
X_list.append(X)
y_list.append(y)y_orig_list = []
res_ = pd.DataFrame({'index' : range(5000)})
i = 0
for X, y in zip(X_list, y_list):
res_['label_' + str(i + 1)] = y
# Convert to positive-unlabeled data where labeled positives are conditionally randomly selected
rf = RandomForestClassifier(
n_estimators = 1000,
max_samples = min(sum(y==0), sum(y==1)),
oob_score = True,
n_jobs = -1,
random_state = 30
)
rf.fit(X, y)
res_['rf_' + str(i + 1)] = rf.oob_decision_function_[:,1]
# Keep the original targets safe for later usage
y_orig = y.copy()
y_orig_list.append(y_orig)
# 99% unlabeled
np.random.seed(0)
y[np.random.choice(np.where((res_['label_' + str(i + 1)] == 1))[0], replace=False, size=50)] = 2
y[y == 1] = 0
y[y == 2] = 1
res_['pu_label_' + str(i + 1)] = y
# Check the new contents of the set
print('%d positive out of %d total' % (sum(y), len(y)))
y_list[i] = y
i += 1
res_.to_csv('./other_data/simulation_labels.csv')def train_purf(features, outcome, res_path, pickle_path='./tmp.pkl', pos_level=0.5, save_model=False):
# Imputation
imputer = SimpleImputer(strategy='median')
X = imputer.fit_transform(features)
X = pd.DataFrame(X, index=features.index, columns=features.columns)
y = outcome
features = X
# Training PURF
purf = PURandomForestClassifier(
n_estimators = 10000,
oob_score = True,
n_jobs = -1,
random_state = 42,
pos_level = pos_level
)
purf.fit(X, y)
# Storing results
res = pd.DataFrame({'protein_id': X.index, 'antigen_label' : y})
res['OOB score'] = purf.oob_decision_function_[:,1]
res = res.groupby('protein_id').mean().merge(features, left_index=True, right_index=True)
res.to_csv(res_path)
if save_model is True:
with open(pickle_path, 'wb') as out:
pickle.dump(purf, out, pickle.HIGHEST_PROTOCOL)
i = 0
for X, y in zip(X_list, y_list):
train_purf(X, y, res_path='./other_data/simulation_res_' + str(i + 1) + '.csv')
i += 12.1.2 Plotting
In R:
library(rlist)
library(pROC)
library(mixR)
library(pracma)
library(reshape2)
library(ggplot2)
library(ggpubr)
library(rstatix)
library(cowplot)
labels <- read.csv("./other_data/simulation_labels.csv")
tmp <- data.frame(sapply(1:5, function(i) read.csv(paste0("./other_data/simulation_res_", i, ".csv"), check.names = FALSE)[, "OOB score", drop = FALSE]))
colnames(tmp) <- sapply(1:5, function(i) paste0("OOB_score_", i))
data <- cbind(tmp, labels[, c(
sapply(1:5, function(i) paste0("label_", i)),
sapply(1:5, function(i) paste0("pu_label_", i))
)])roc_true_labels <- list()
auroc_true_labels <- c()
for (i in 1:5) {
roc_ <- roc(response = data[, paste0("label_", i)], predictor = data[, paste0("OOB_score_", i)])
roc_true_labels <- list.append(roc_true_labels, data.frame(fpr = 1 - roc_$specificities, tpr = roc_$sensitivities))
auroc_true_labels <- c(auroc_true_labels, as.numeric(roc_$auc))
}
roc_pu_labels <- list()
auroc_pu_labels <- c()
for (i in 1:5) {
roc_ <- roc(response = data[, paste0("pu_label_", i)], predictor = data[, paste0("OOB_score_", i)])
roc_pu_labels <- list.append(roc_pu_labels, data.frame(fpr = 1 - roc_$specificities, tpr = roc_$sensitivities))
auroc_pu_labels <- c(auroc_pu_labels, as.numeric(roc_$auc))
}
roc_estimated <- list()
auroc_estimated <- c()
for (i in 1:5) {
fit <- mixfit(data[, paste0("OOB_score_", i)], ncomp = 2)
# Calculate receiver operating characteristic (ROC) curve
# for putative positive and negative samples
x <- seq(-0.5, 1.5, by = 0.01)
neg_cum <- pnorm(x, mean = fit$mu[1], sd = fit$sd[1])
pos_cum <- pnorm(x, mean = fit$mu[2], sd = fit$sd[2])
fpr <- (1 - neg_cum) / ((1 - neg_cum) + neg_cum) # false positive / (false positive + true negative)
tpr <- (1 - pos_cum) / ((1 - pos_cum) + pos_cum) # true positive / (true positive + false negative)
roc_estimated <- list.append(roc_estimated, data.frame(fpr = fpr, tpr = tpr))
auroc_estimated <- c(auroc_estimated, as.numeric(trapz(-fpr, tpr)))
}sem <- function(x, na.rm = TRUE) sd(x, na.rm) / sqrt(length(na.omit(x)))
ds <- rbind(
do.call(rbind, roc_true_labels),
do.call(rbind, roc_pu_labels),
do.call(rbind, roc_estimated)
)
ds$group <- c(
do.call("c", sapply(1:5, function(i) rep(paste("True labels"), nrow(roc_true_labels[[i]])))),
do.call("c", sapply(1:5, function(i) rep(paste("PU labels"), nrow(roc_pu_labels[[i]])))),
melt(sapply(1:5, function(i) rep(paste("Estimated"), nrow(roc_estimated[[i]]))))$value
)
ds$group <- factor(ds$group)
ds$sub_group <- c(
do.call("c", sapply(1:5, function(i) rep(paste("True labels", i), nrow(roc_true_labels[[i]])))),
do.call("c", sapply(1:5, function(i) rep(paste("PU labels", i), nrow(roc_pu_labels[[i]])))),
melt(sapply(1:5, function(i) rep(paste("Estimated", i), nrow(roc_estimated[[i]]))))$value
)
ds$sub_group <- factor(ds$sub_group)
p1 <- ggplot(ds, aes(x = fpr, y = tpr, colour = group, group = sub_group)) +
geom_line(size = 0.2) +
scale_colour_manual(
values = c("#E41A1C", "#377EB8", "#4DAF4A"),
breaks = c("Estimated", "True labels", "PU labels"),
labels = c(
paste0(
"Estimated (AUROC = ", round(mean(auroc_estimated), 3), " ± ",
round(sem(auroc_estimated), 3), ")"
),
paste0(
"True labels (AUROC = ", round(mean(auroc_true_labels), 3), " ± ",
round(sem(auroc_true_labels), 3), ")"
),
paste0(
"PU labels (AUROC = ", round(mean(auroc_pu_labels), 3), " ± ",
round(sem(auroc_pu_labels), 3), ")"
)
)
) +
theme_bw() +
theme(
panel.grid.major = element_blank(),
panel.grid.minor = element_blank(),
axis.title = element_text(colour = "black"),
axis.text = element_text(colour = "black"),
plot.title = element_text(hjust = 0.5, colour = "black"),
plot.margin = ggplot2::margin(5, 5, 5, 5, "pt"),
legend.title = element_blank(),
legend.text = element_text(colour = "black"),
legend.position = c(0.6, 0.2),
legend.background = element_blank()
) +
xlab("False positive rate") +
ylab("True positive rate")ds <- data.frame("AUROC" = c(auroc_true_labels, auroc_pu_labels, auroc_estimated))
ds$group <- c(
rep("True labels", length(auroc_true_labels)),
rep("PU labels", length(auroc_pu_labels)),
rep("Estimated", length(auroc_estimated))
)
ds$group <- factor(ds$group, levels = c("Estimated", "True labels", "PU labels"))
stats <- wilcox_test(ds, AUROC ~ group, p.adjust.method = "BH")
stats <- stats %>% add_xy_position(fun = "mean_se", x = "group")
p2 <- ggbarplot(ds,
x = "group", y = "AUROC", add = "mean_se", fill = "group", alpha = 0.2, size = 0.3,
add.params = list(size = 0.3)
) +
scale_colour_manual(
values = c("#E41A1C", "#377EB8", "#4DAF4A"),
breaks = c("Estimated", "True labels", "PU labels")
) +
stat_pvalue_manual(stats, label = "p = {p.adj}", size = 3) +
theme_bw() +
theme(
panel.grid.major = element_blank(),
panel.grid.minor = element_blank(),
axis.title = element_text(colour = "black"),
axis.text = element_text(colour = "black"),
plot.title = element_text(hjust = 0.5, colour = "black"),
plot.margin = ggplot2::margin(5, 5, 5, 5, "pt"),
legend.title = element_blank(),
legend.text = element_text(colour = "black"),
legend.position = "none",
legend.background = element_blank()
) +
xlab("")Final plot
p_combined <- plot_grid(p1, p2, nrow = 1, labels = c("a", "b"))
p_combined
2.2 Hyper-parameter tuning for PURF
2.2.1 Analysis
In Python:
import pandas as pd
import numpy as np
from sklearn.impute import SimpleImputer
from sklearn.preprocessing import MinMaxScaler
from scipy.spatial import distance
from purf.pu_ensemble import PURandomForestClassifier
import pickle
import os
import re
# input set (5393, 1 + 272)
data = pd.read_csv('./data/supplementary_data_3_pf_ml_input.csv', index_col=0)
pf3d7_features = data.iloc[:,1:]
pf3d7_outcome = np.array(data.antigen_label)def train_purf(features, outcome, pos_level, res_path, pickle_path):
# Imputation
imputer = SimpleImputer(strategy='median')
X = imputer.fit_transform(features)
X = pd.DataFrame(X, index=features.index, columns=features.columns)
y = outcome
features = X
# Training PURF
purf = PURandomForestClassifier(
n_estimators = 100000,
oob_score = True,
n_jobs = 64,
random_state = 42,
pos_level = pos_level
)
purf.fit(X, y)
# Storing results
res = pd.DataFrame({'protein_id': X.index, 'antigen_label': y})
res['OOB score'] = purf.oob_decision_function_[:,1]
res = res.groupby('protein_id').mean().merge(features, left_index=True, right_on='protein_id')
res = res[['antigen_label', 'OOB score']]
features.to_csv(res_path, sep='\t')
with open(pickle_path, 'wb') as out:
pickle.dump(purf, out, pickle.HIGHEST_PROTOCOL)for pos_level in [0.5, 0.4, 0.6, 0.3, 0.7, 0.2, 0.8, 0.1, 0.9]:
train_purf(pf3d7_features, pf3d7_outcome, pos_level=pos_level,
res_path='~/Downloads/pos_level/without_weighting/%.1f_res.tsv' % pos_level,
pickle_path='~/Downloads/pos_level/without_weighting/%.1f_purf.pkl' % pos_level)dir = '~/Downloads/pos_level/without_wighting/'
files = os.listdir(dir)
tmp = pd.read_csv(dir + '0.1_res.tsv', sep='\t', index_col=0)['antigen_label']
data_frames = [pd.read_csv(dir + '%.1f_res.tsv' % pos_level, sep='\t', index_col=0)['OOB scores'] for pos_level in np.arange(0.1, 1, 0.1)]
merged_df = pd.concat([tmp] + data_frames, join='outer', axis=1)
colnames = ['antigen_label'] + ['%.1f' % pos_level for pos_level in np.arange(0.1, 1, 0.1)]
merged_df.columns = colnames
merged_df.to_csv('./other_data/pos_level_parameter_tuning_wo_weighting.csv')2.2.2 Plotting
In R:
library(mixR)
library(pracma)
library(rlist)
library(ggplot2)
library(cowplot)
library(grid)
library(gridExtra)
data <- read.csv("./other_data/pos_level_parameter_tuning_wo_weighting.csv", header = TRUE, row.names = 1, check.names = FALSE)
# Extract data with only unlabeled proteins
data_unl <- data[data$antigen_label == 0, ]plot_list <- list()
plot_list2 <- list()
for (i in seq(0.1, 0.9, 0.1)) {
fit <- mixfit(data_unl[[as.character(i)]], ncomp = 2)
# Calculate receiver operating characteristic (ROC) curve
# for putative positive and negative samples
x <- seq(-0.5, 1.5, by = 0.01)
neg_cum <- pnorm(x, mean = fit$mu[1], sd = fit$sd[1])
pos_cum <- pnorm(x, mean = fit$mu[2], sd = fit$sd[2])
fpr <- (1 - neg_cum) / ((1 - neg_cum) + neg_cum) # false positive / (false positive + true negative)
tpr <- (1 - pos_cum) / ((1 - pos_cum) + pos_cum) # true positive / (true positive + false negative)
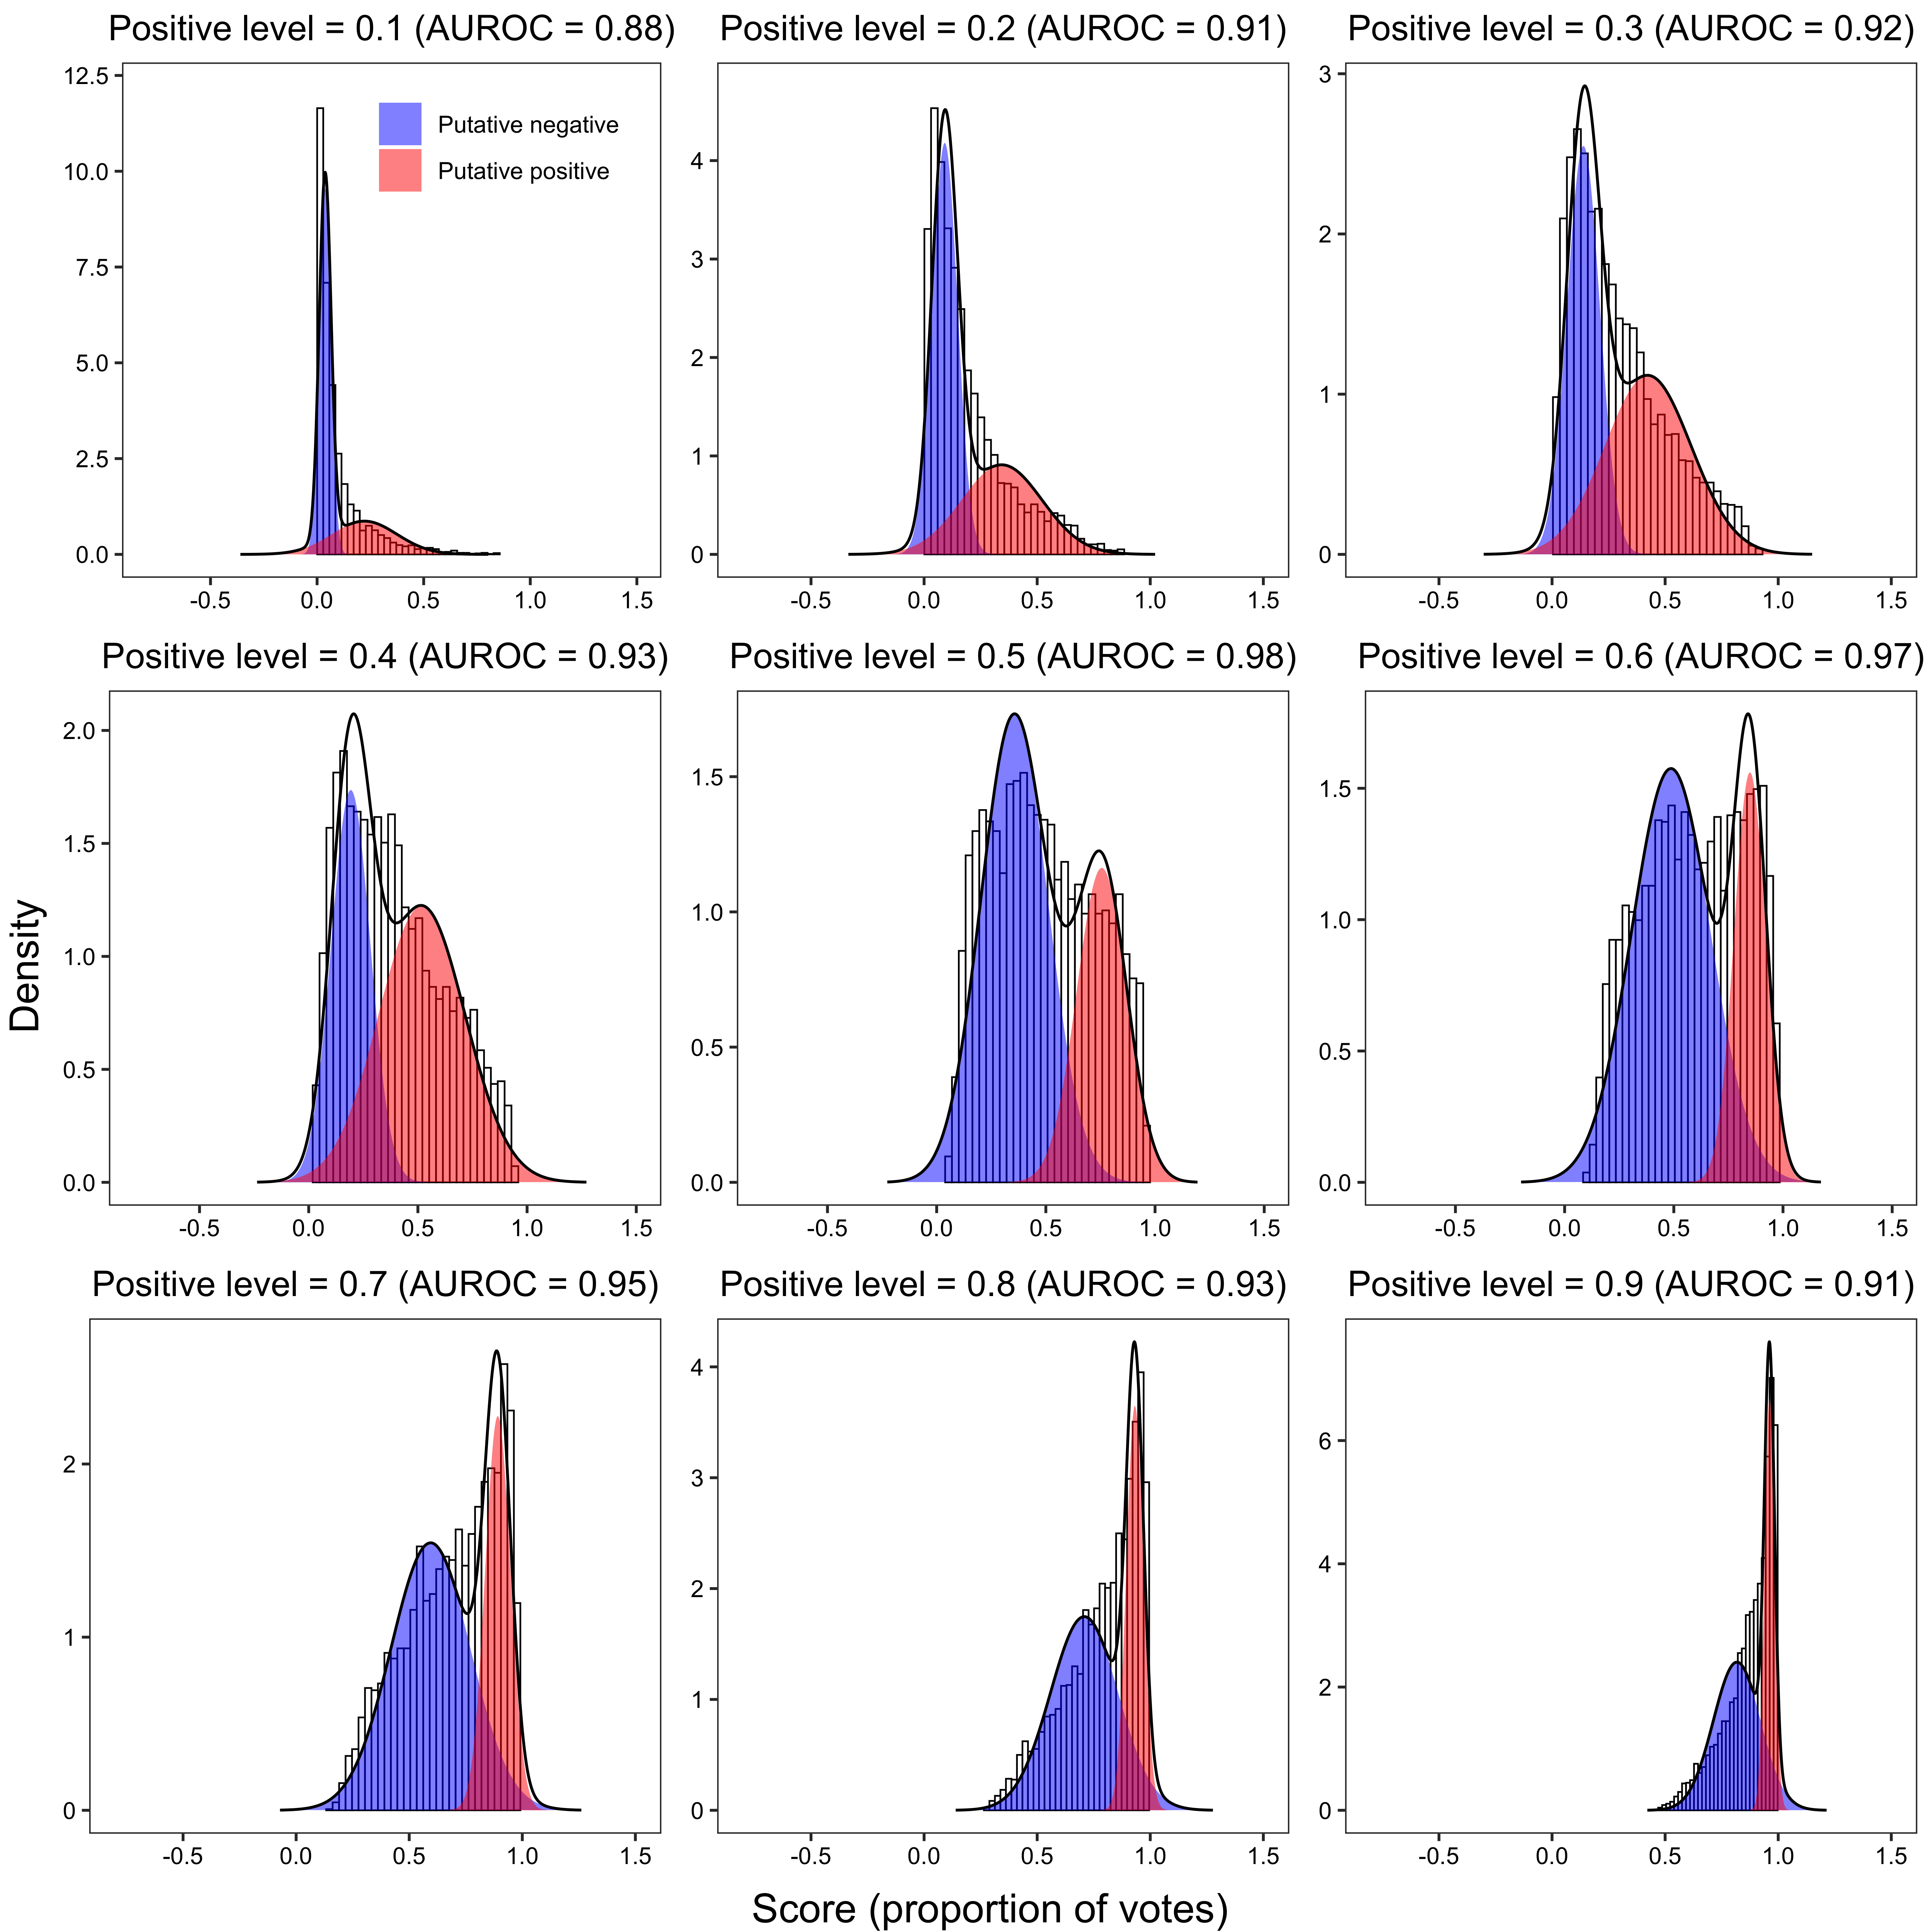
p <- plot(fit, title = paste0(
"Positive level = ", i,
" (AUROC = ", round(trapz(-fpr, tpr), 2), ")"
)) +
scale_fill_manual(values = c("blue", "red"), labels = c("Putative negative", "Putative positive")) +
theme_bw() +
{
if (i == 0.1) {
theme(
panel.grid.major = element_blank(),
panel.grid.minor = element_blank(),
axis.title = element_blank(),
axis.text = element_text(colour = "black"),
plot.title = element_text(hjust = 0.5, colour = "black"),
legend.title = element_blank(),
legend.text = element_text(colour = "black"),
legend.position = c(0.7, 0.85),
legend.background = element_blank()
)
} else {
theme(
panel.grid.major = element_blank(),
panel.grid.minor = element_blank(),
axis.title = element_blank(),
axis.text = element_text(colour = "black"),
plot.title = element_text(hjust = 0.5, colour = "black"),
legend.position = "none"
)
}
} +
xlim(-0.8, 1.5)
# Calculate percent rank for labeled positives
data_ <- data[c("antigen_label", as.character(i))]
colnames(data_) <- c("antigen_label", "OOB score")
data_$percent_rank <- rank(data_[["OOB score"]]) / nrow(data)
data_ <- data_[data$antigen_label == 1, ]
data_ <- data_[order(-data_$percent_rank), ]
data_$x <- 1:nrow(data_) / nrow(data_)
cat(paste0("EPR: ", sum(data_$`OOB score` >= 0.5) / nrow(data_), "\n"))
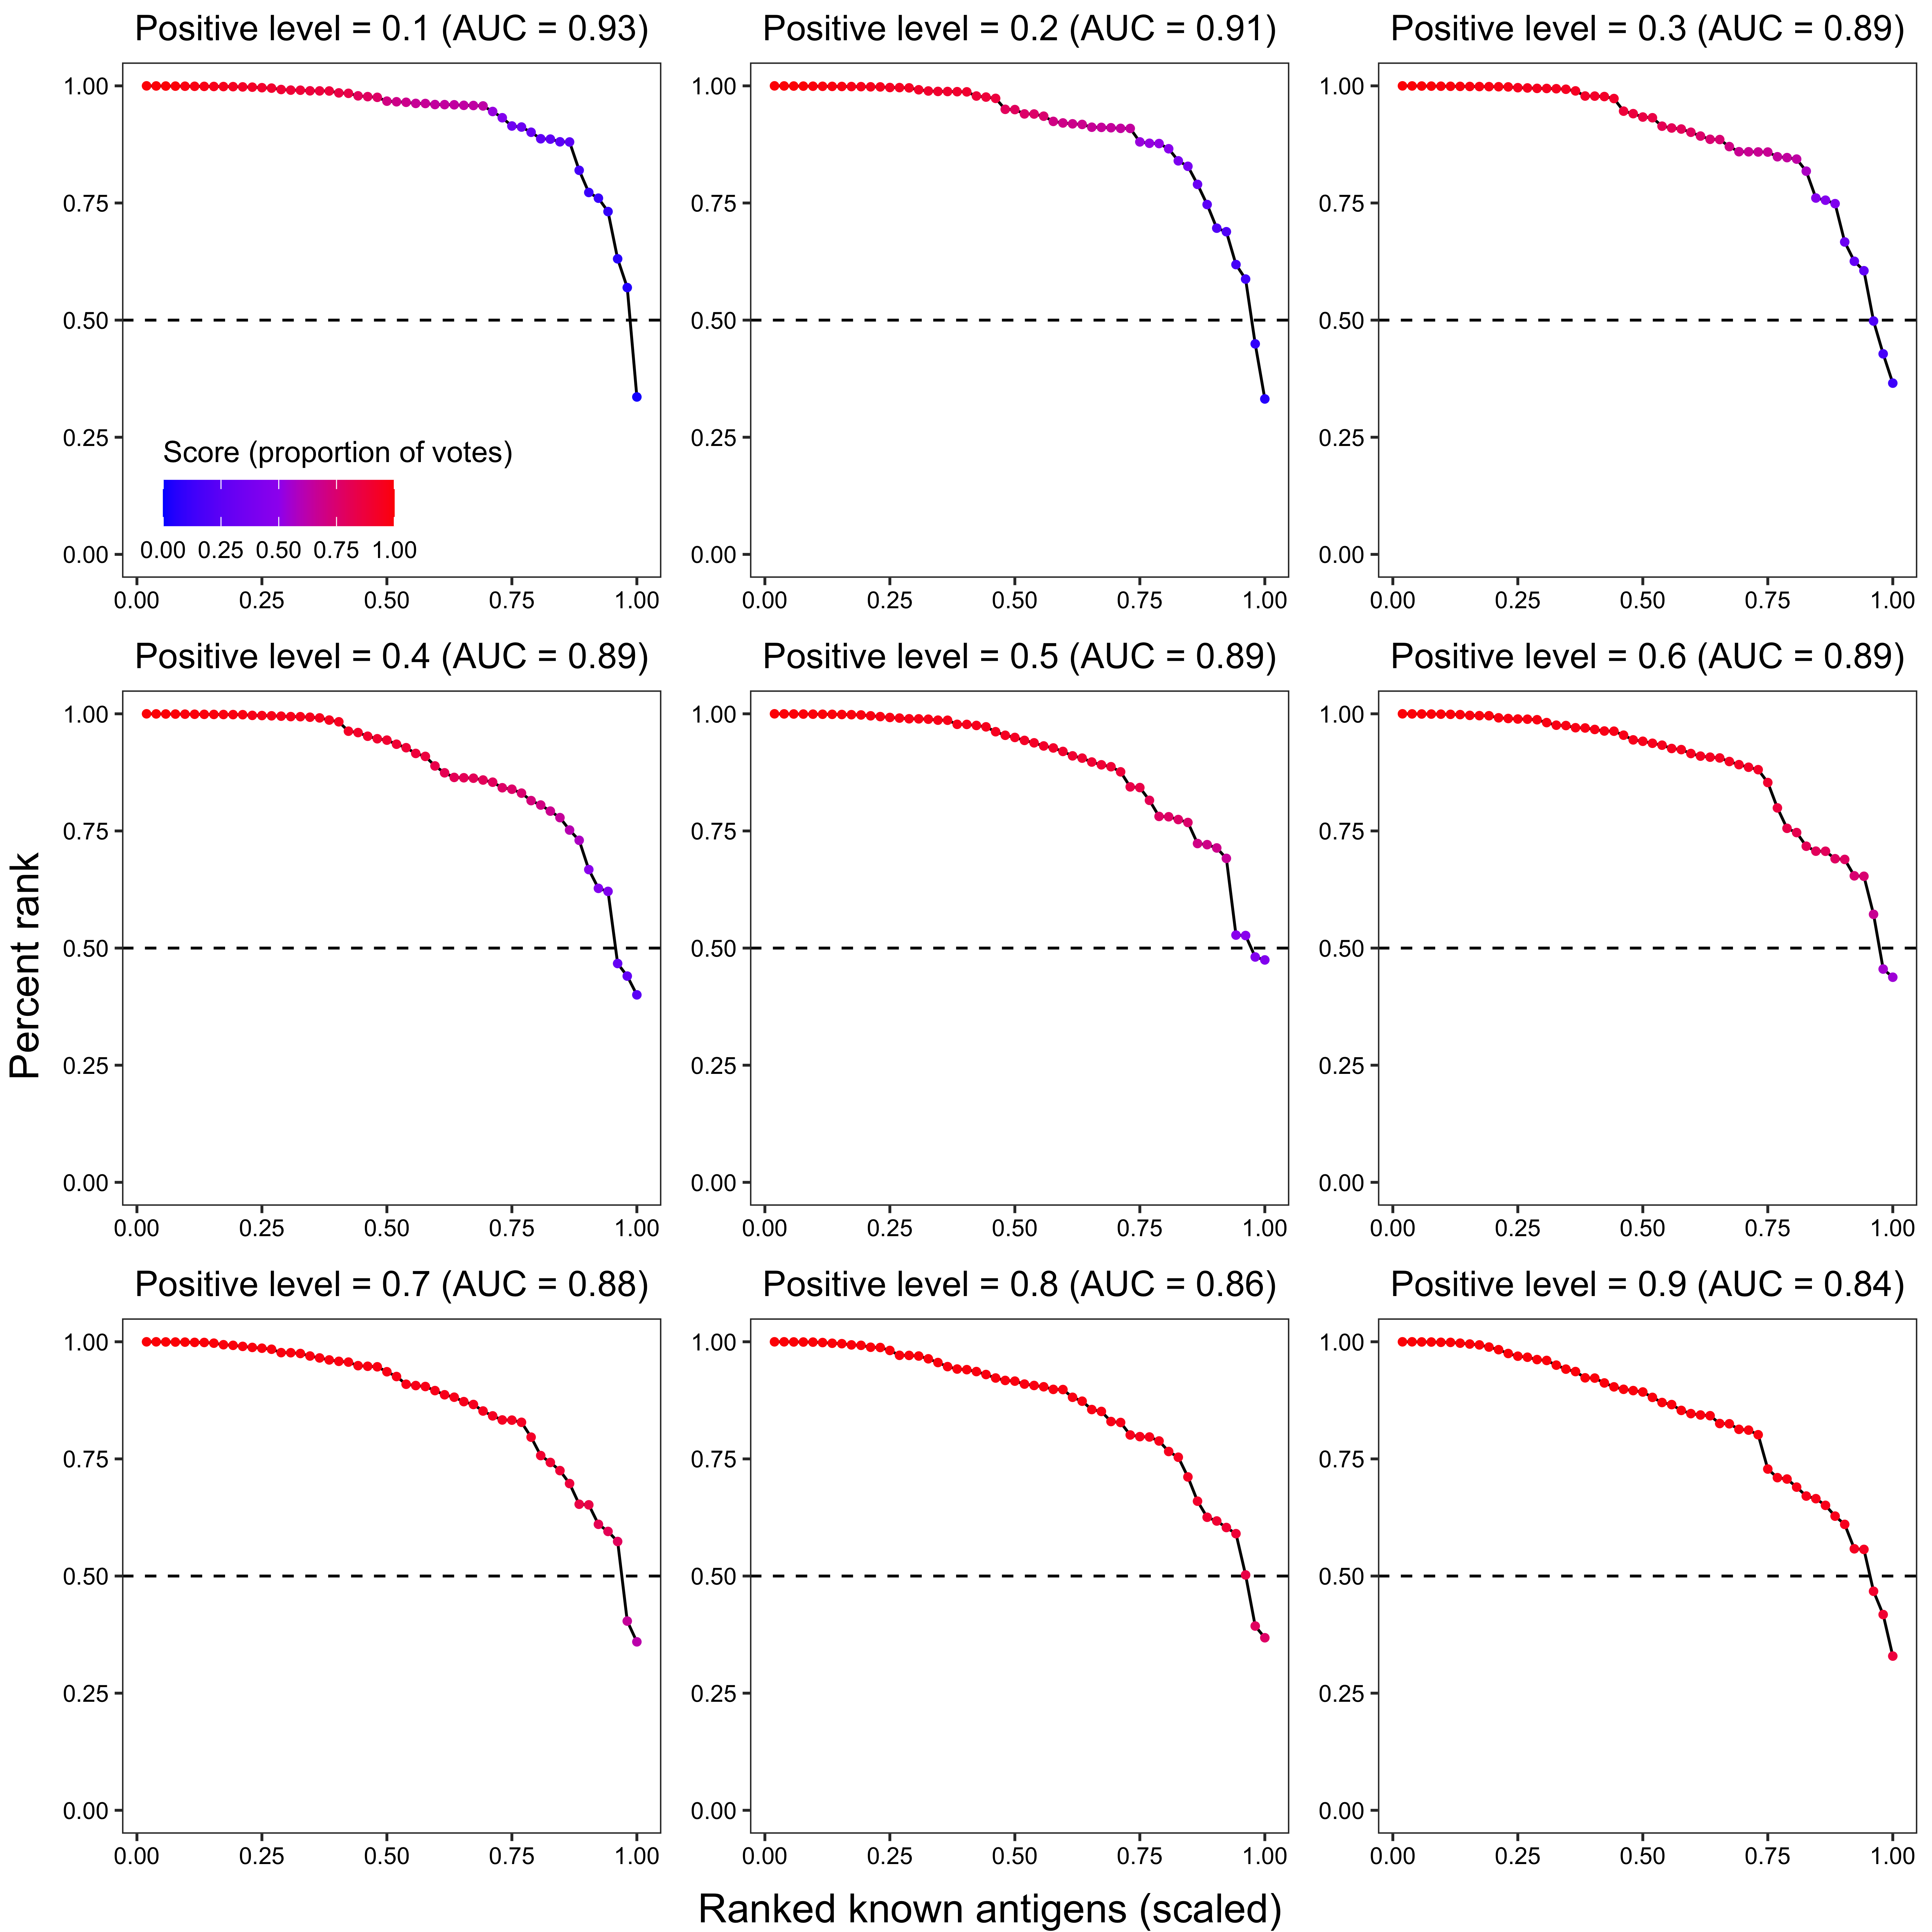
p2 <- ggplot(data_, aes(x = x, y = `percent_rank`)) +
geom_hline(yintercept = 0.5, linetype = "dashed", color = "black") +
geom_line() +
geom_point(aes(color = `OOB score`), size = 1) +
scale_colour_gradient2(low = "blue", mid = "purple", high = "red", midpoint = 0.5, limits = c(0, 1)) +
theme_bw() +
{
if (i == 0.1) {
theme(
panel.grid.major = element_blank(),
panel.grid.minor = element_blank(),
axis.title = element_blank(),
axis.text = element_text(colour = "black"),
plot.title = element_text(hjust = 0.5, colour = "black"),
legend.title = element_text(hjust = 0.5, colour = "black", angle = 0),
legend.text = element_text(colour = "black"),
legend.position = c(0.4, 0.15),
legend.background = element_blank()
)
} else {
theme(
panel.grid.major = element_blank(),
panel.grid.minor = element_blank(),
axis.title = element_blank(),
axis.text = element_text(colour = "black"),
plot.title = element_text(hjust = 0.5, colour = "black"),
legend.position = "none"
)
}
} +
{
if (i == 0.1) {
guides(colour = guide_colourbar(title.position = "top", direction = "horizontal"))
}
} +
{
if (i == 0.1) {
labs(colour = "Score (proportion of votes)")
}
} +
ggtitle(paste0(
"Positive level = ", i,
" (AUC = ", round(trapz(c(0, data_$x, 1), c(1, data_$percent_rank, 0)), 2), ")"
)) +
ylim(0, 1)
plot_list <- list.append(plot_list, p)
plot_list2 <- list.append(plot_list2, p2)
}2.3 Variable space weighting
2.3.1 Analysis
In Python:
from sklearn.datasets import make_classification
import pandas as pd
from sklearn.ensemble import RandomForestClassifier
import numpy as np
from sklearn.impute import SimpleImputer
from sklearn.preprocessing import MinMaxScaler
from scipy.spatial import distance
from purf.pu_ensemble import PURandomForestClassifier
import pickle
import os
import re
import session_info# input set (5393, 1 + 272)
data = pd.read_csv('./data/supplementary_data_3_pf_ml_input.csv', index_col=0)
pf3d7_features = data.iloc[:,1:]
pf3d7_outcome = np.array(data.antigen_label)def train_purf(features, outcome, pos_level, res_path, pickle_path):
# Imputation
imputer = SimpleImputer(strategy='median')
X = imputer.fit_transform(features)
X = pd.DataFrame(X, index=features.index, columns=features.columns)
y = outcome
features = X
print('There are %d positives out of %d samples before variable space weighting.' % (sum(y), len(y)))
# variable space weighting
lab_pos = X.loc[y==1,:]
median = np.median(lab_pos, axis=0)
# variable space weighting
lab_pos = X.loc[y==1,:]
median = np.median(lab_pos, axis=0)
scaler = MinMaxScaler(feature_range=(1,10))
dist = list()
for i in range(lab_pos.shape[0]):
dist.append(distance.euclidean(lab_pos.iloc[i, :], median))
dist = np.asarray(dist).reshape(-1, 1)
counts = np.round(scaler.fit_transform(dist))
counts = np.array(counts, dtype=np.int64)[:, 0]
X_temp = X.iloc[y==1, :]
X = X.iloc[y==0, :]
y = np.asarray([0] * X.shape[0] + [1] * (sum(counts)))
appended_data = [X]
for i in range(len(counts)):
appended_data.append(pd.concat([X_temp.iloc[[i]]] * counts[i]))
X = pd.concat(appended_data)
print('There are %d positives out of %d samples after variable space weighting.' % (sum(y), len(y)))
# Training PURF
purf = PURandomForestClassifier(
n_estimators = 100000,
oob_score = True,
n_jobs = 64,
random_state = 42,
pos_level = pos_level
)
purf.fit(X, y)
# Storing results
res = pd.DataFrame({'protein_id': X.index, 'antigen_label': y})
res['OOB score'] = purf.oob_decision_function_[:,1]
res = res.groupby('protein_id').mean().merge(features, left_index=True, right_on='protein_id')
res = res[['antigen_label', 'OOB score']]
features.to_csv(res_path, sep='\t')
with open(pickle_path, 'wb') as out:
pickle.dump(purf, out, pickle.HIGHEST_PROTOCOL)for pos_level in [0.5, 0.4, 0.6, 0.3, 0.7, 0.2, 0.8, 0.1, 0.9]:
train_purf(pf3d7_features, pf3d7_outcome, pos_level=pos_level,
res_path='~/Downloads/pos_level/with_weighting/%.1f_res.tsv' % pos_level,
pickle_path='~/Downloads/pos_level/with_weighting/%.1f_purf.pkl' % pos_level)dir = '~/Downloads/pos_level/with_weighting/'
files = os.listdir(dir)
tmp = pd.read_csv(dir + '0.1_res.tsv', sep='\t', index_col=0)['antigen_label']
data_frames = [pd.read_csv(dir + '%.1f_res.tsv' % pos_level, sep='\t', index_col=0)['OOB scores'] for pos_level in np.arange(0.1, 1, 0.1)]
merged_df = pd.concat([tmp] + data_frames, join='outer', axis=1)
colnames = ['antigen_label'] + ['%.1f' % pos_level for pos_level in np.arange(0.1, 1, 0.1)]
merged_df.columns = colnames
merged_df.to_csv('./other_data/pos_level_parameter_tuning_w_weighting.csv')2.3.2 Plotting
In R:
library(mixR)
library(pracma)
library(rlist)
library(ggplot2)
library(cowplot)
library(grid)
library(gridExtra)data <- read.csv("./other_data/pos_level_parameter_tuning_w_weighting.csv", header = TRUE, row.names = 1, check.names = FALSE)
# Extract data with only unlabeled proteins
data_unl <- data[data$antigen_label == 0, ]plot_list <- list()
plot_list2 <- list()
for (i in seq(0.1, 0.9, 0.1)) {
fit <- mixfit(data_unl[[as.character(i)]], ncomp = 2)
# Calculate receiver operating characteristic (ROC) curve
# for putative positive and negative samples
x <- seq(-0.5, 1.5, by = 0.01)
neg_cum <- pnorm(x, mean = fit$mu[1], sd = fit$sd[1])
pos_cum <- pnorm(x, mean = fit$mu[2], sd = fit$sd[2])
fpr <- (1 - neg_cum) / ((1 - neg_cum) + neg_cum) # false positive / (false positive + true negative)
tpr <- (1 - pos_cum) / ((1 - pos_cum) + pos_cum) # true positive / (true positive + false negative)
p <- plot(fit, title = paste0(
"Positive level = ", i,
" (AUROC = ", round(trapz(-fpr, tpr), 2), ")"
)) +
scale_fill_manual(values = c("blue", "red"), labels = c("Putative negative", "Putative positive")) +
theme_bw() +
{
if (i == 0.1) {
theme(
panel.grid.major = element_blank(),
panel.grid.minor = element_blank(),
axis.title = element_blank(),
axis.text = element_text(colour = "black"),
plot.title = element_text(hjust = 0.5, colour = "black"),
legend.title = element_blank(),
legend.text = element_text(colour = "black"),
legend.position = c(0.7, 0.85),
legend.background = element_blank()
)
} else {
theme(
panel.grid.major = element_blank(),
panel.grid.minor = element_blank(),
axis.title = element_blank(),
axis.text = element_text(colour = "black"),
plot.title = element_text(hjust = 0.5, colour = "black"),
legend.position = "none"
)
}
} +
xlim(-0.8, 1.5)
# Calculate percent rank for labeled positives
data_ <- data[c("antigen_label", as.character(i))]
colnames(data_) <- c("antigen_label", "OOB score")
data_$percent_rank <- rank(data_[["OOB score"]]) / nrow(data)
data_ <- data_[data$antigen_label == 1, ]
data_ <- data_[order(-data_$percent_rank), ]
data_$x <- 1:nrow(data_) / nrow(data_)
cat(paste0("EPR: ", sum(data_$`OOB score` >= 0.5) / nrow(data_), "\n"))
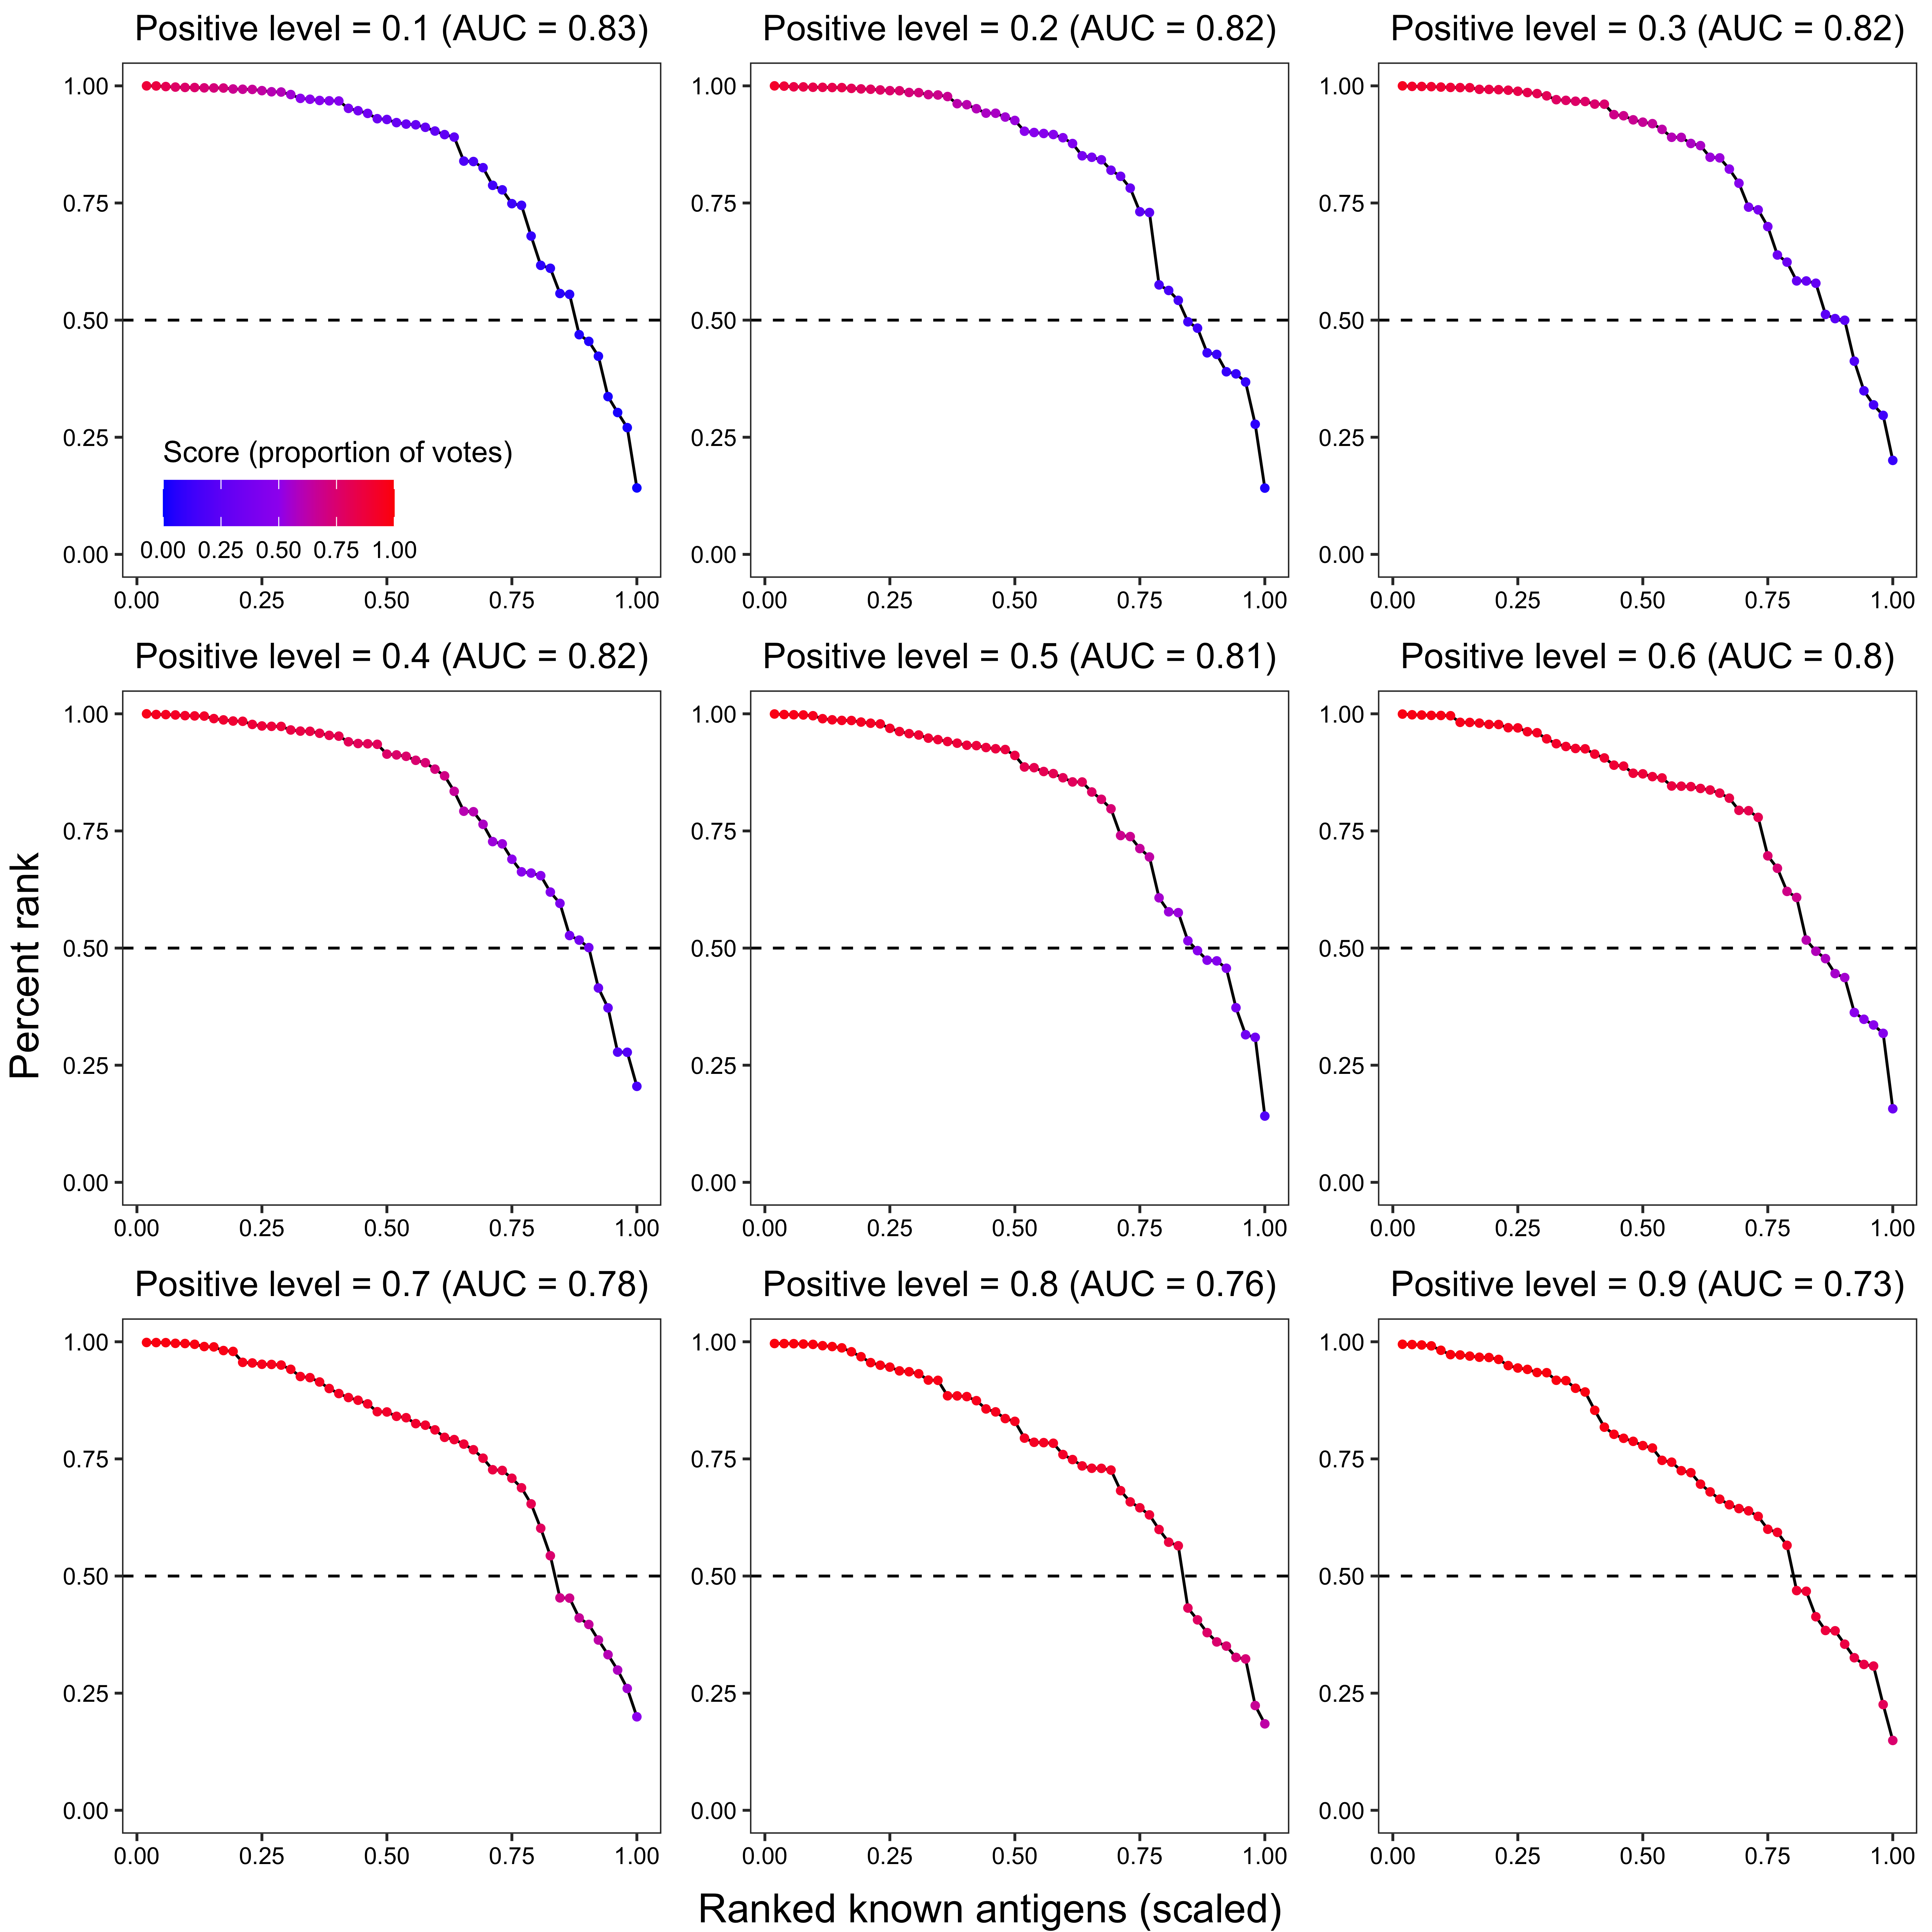
p2 <- ggplot(data_, aes(x = x, y = `percent_rank`)) +
geom_hline(yintercept = 0.5, linetype = "dashed", color = "black") +
geom_line() +
geom_point(aes(color = `OOB score`), size = 1) +
scale_colour_gradient2(low = "blue", mid = "purple", high = "red", midpoint = 0.5, limits = c(0, 1)) +
theme_bw() +
{
if (i == 0.1) {
theme(
panel.grid.major = element_blank(),
panel.grid.minor = element_blank(),
axis.title = element_blank(),
axis.text = element_text(colour = "black"),
plot.title = element_text(hjust = 0.5, colour = "black"),
legend.title = element_text(hjust = 0.5, colour = "black", angle = 0),
legend.text = element_text(colour = "black"),
legend.position = c(0.4, 0.15),
legend.background = element_blank()
)
} else {
theme(
panel.grid.major = element_blank(),
panel.grid.minor = element_blank(),
axis.title = element_blank(),
axis.text = element_text(colour = "black"),
plot.title = element_text(hjust = 0.5, colour = "black"),
legend.position = "none"
)
}
} +
{
if (i == 0.1) {
guides(colour = guide_colourbar(title.position = "top", direction = "horizontal"))
}
} +
{
if (i == 0.1) {
labs(colour = "Score (proportion of votes)")
}
} +
ggtitle(paste0(
"Positive level = ", i,
" (AUC = ", round(trapz(c(0, data_$x, 1), c(1, data_$percent_rank, 0)), 2), ")"
)) +
ylim(0, 1)
plot_list <- list.append(plot_list, p)
plot_list2 <- list.append(plot_list2, p2)
}2.3.2.1 Bimodal distribution plot
x_grob <- textGrob("Score (proportion of votes)", gp = gpar(fontsize = 15))
y_grob <- textGrob("Density", gp = gpar(fontsize = 15), rot = 90)
grid.arrange(arrangeGrob(plot_grid(plotlist = plot_list, ncol = 3), left = y_grob, bottom = x_grob))
2.3.2.2 Known antigen ranking
x_grob2 <- textGrob("Ranked known antigens (scaled)", gp = gpar(fontsize = 15))
y_grob2 <- textGrob("Percent rank", gp = gpar(fontsize = 15), rot = 90)
grid.arrange(arrangeGrob(plot_grid(plotlist = plot_list2, ncol = 3), left = y_grob2, bottom = x_grob2))
sessionInfo()## R version 4.2.3 (2023-03-15)
## Platform: x86_64-apple-darwin17.0 (64-bit)
## Running under: macOS Big Sur ... 10.16
##
## Matrix products: default
## BLAS: /Library/Frameworks/R.framework/Versions/4.2/Resources/lib/libRblas.0.dylib
## LAPACK: /Library/Frameworks/R.framework/Versions/4.2/Resources/lib/libRlapack.dylib
##
## locale:
## [1] en_US.UTF-8/en_US.UTF-8/en_US.UTF-8/C/en_US.UTF-8/en_US.UTF-8
##
## attached base packages:
## [1] grid stats graphics grDevices utils datasets methods
## [8] base
##
## other attached packages:
## [1] gridExtra_2.3 cowplot_1.1.1 rstatix_0.7.0 ggpubr_0.4.0 ggplot2_3.4.2
## [6] reshape2_1.4.4 pracma_2.3.8 mixR_0.2.0 pROC_1.18.0 rlist_0.4.6.2
##
## loaded via a namespace (and not attached):
## [1] Rcpp_1.0.9 lattice_0.20-45 tidyr_1.2.0 png_0.1-7
## [5] assertthat_0.2.1 digest_0.6.29 utf8_1.2.2 R6_2.5.1
## [9] plyr_1.8.7 backports_1.4.1 evaluate_0.16 highr_0.9
## [13] pillar_1.8.1 rlang_1.1.0 rstudioapi_0.14 data.table_1.14.2
## [17] car_3.1-0 jquerylib_0.1.4 R.utils_2.12.0 R.oo_1.25.0
## [21] Matrix_1.5-3 reticulate_1.25 rmarkdown_2.16 styler_1.8.0
## [25] stringr_1.4.1 munsell_0.5.0 broom_1.0.0 compiler_4.2.3
## [29] xfun_0.32 pkgconfig_2.0.3 htmltools_0.5.3 tidyselect_1.1.2
## [33] tibble_3.1.8 bookdown_0.28 codetools_0.2-19 fansi_1.0.3
## [37] dplyr_1.0.9 withr_2.5.0 R.methodsS3_1.8.2 jsonlite_1.8.0
## [41] gtable_0.3.0 lifecycle_1.0.3 DBI_1.1.3 magrittr_2.0.3
## [45] scales_1.2.1 carData_3.0-5 cli_3.6.1 stringi_1.7.8
## [49] cachem_1.0.6 ggsignif_0.6.3 bslib_0.4.0 generics_0.1.3
## [53] vctrs_0.6.2 tools_4.2.3 R.cache_0.16.0 glue_1.6.2
## [57] purrr_0.3.4 abind_1.4-5 fastmap_1.1.0 yaml_2.3.5
## [61] colorspace_2.0-3 knitr_1.40 sass_0.4.2
